Unless you’ve been sleeping under a rock for the last few years, you’re probably aware of the growing phenomenon of sleep tracking and sleep perfectionism that’s been making its way around the Western world.
From snazzy rings you can wear on your fingers to modern tracking systems built straight into our mattresses, nowadays, it seems you can’t go five minutes without stumbling across another study praising the power of sleep trackers and their mystical ability to suddenly improve your sleep.
But how true is this really? After all, our own recent study into UK sleep rates suggests that 74% of people are getting less than 6 hours of sleep per night, while data from other scientific papers indicate that, far from improving the quality of our sleep, this obsession with perfecting every area of our rest may actually be making it worse.
From the heart of Europe to the fringes of Canada, more and more evidence is showing that the rates of sleep anxiety and other common sleep disorders are on the rise. And what’s worse is that we’ve seen an entirely new sleep disorder emerge from this sleep tracking obsession – orthosomnia.
Which all begs the question: Are sleep trackers actually contributing to the growth of global sleep anxiety?
Well, to find out, our very own team of in-house experts set out to conduct a sleep pressure survey across the UK and US to find out which cities were seeing the greatest rise in sleep anxiety and orthosomnia, based on detailed search data around the topic.
Find out what we discovered below.
What is orthosomnia?
Before we get into the nitty-gritty breakdown of our new study’s data, let’s take a quick moment to properly explain what orthosomnia is and the wider impact it’s starting to have on people’s lives.
While yet to get an official definition from scientists, those who suffer from orthosomnia characterise it as having an obsessive (and we use this term quite literally) pursuit of getting a perfect night’s sleep – every, single, night.
As you might imagine, doing this without any form of tracking technology would be next to impossible, which is why most orthosomnia sufferers often make use of one or more sleep tracking systems to provide them with constant and ‘precise’ feedback on how restful their previous eight hours were – hence why scientists think there’s a link between the two.
And if we’re being honest, it’s not too hard to connect the dots on how a sleep tracking obsession might perpetuate a rise in sleep anxiety.
Cyclical in nature and more disruptive the longer it goes on, those who’ve experienced orthosomnia point out that the metrics provided to them by their sleep trackers made them more anxious about their sleep quality, which made their sleep worse, which then increased anxiety levels, and so on and so forth.
Worse still, some orthosomniacs have wound up either diagnosing themselves with other sleep disorders where none existed to begin with, exacerbating ones that were already present, or developing one as a result of their mounting sleep deprivation and anxiety.
All of which is to say that orthosomnia might just be one of the more insidious sleep disorders out there – and it’s only becoming more common.
What are the symptoms of orthosomnia?
Being a relatively new sleep disorder, orthosomnia does not have a full list of symptoms that can be used to determine a diagnosis, and many symptoms that sufferers do report often match those of other sleep disorders.
But, with all that being said, the most common cases of orthosomnia tend to manifest as one or more of the following:
- Worsening sleep quality.
- A sense of feeling tired despite getting a full night’s sleep.
- Fatigue and irritability.
- Problems with concentration and memory.
- Increased anxiety about sleep and going to bed.
- Increased anxiety about checking your sleep tracking statistics.
- Increased anxiety levels when not able to track your sleep metrics.
What is sleep anxiety, and how is it different to orthosomnia?
One of the main symptoms of orthosomnia, sleep anxiety specifically refers to a state of anxiety experienced in relation to sleep – both in regard to falling asleep or not getting enough.
But while similar in how their symptoms manifest, sleep anxiety and orthosomnia are not the same thing, and you likely won’t have orthosomnia unless your sleep anxiety is related to sleep tracking or sleep perfectionism in some way.
Which are the most sleep-anxious cities in the UK?
Now that you have a better idea of what orthosomnia is, let’s see which cities in the UK and US are experiencing the highest increases in this sort of sleep pressure, starting with right here at home:
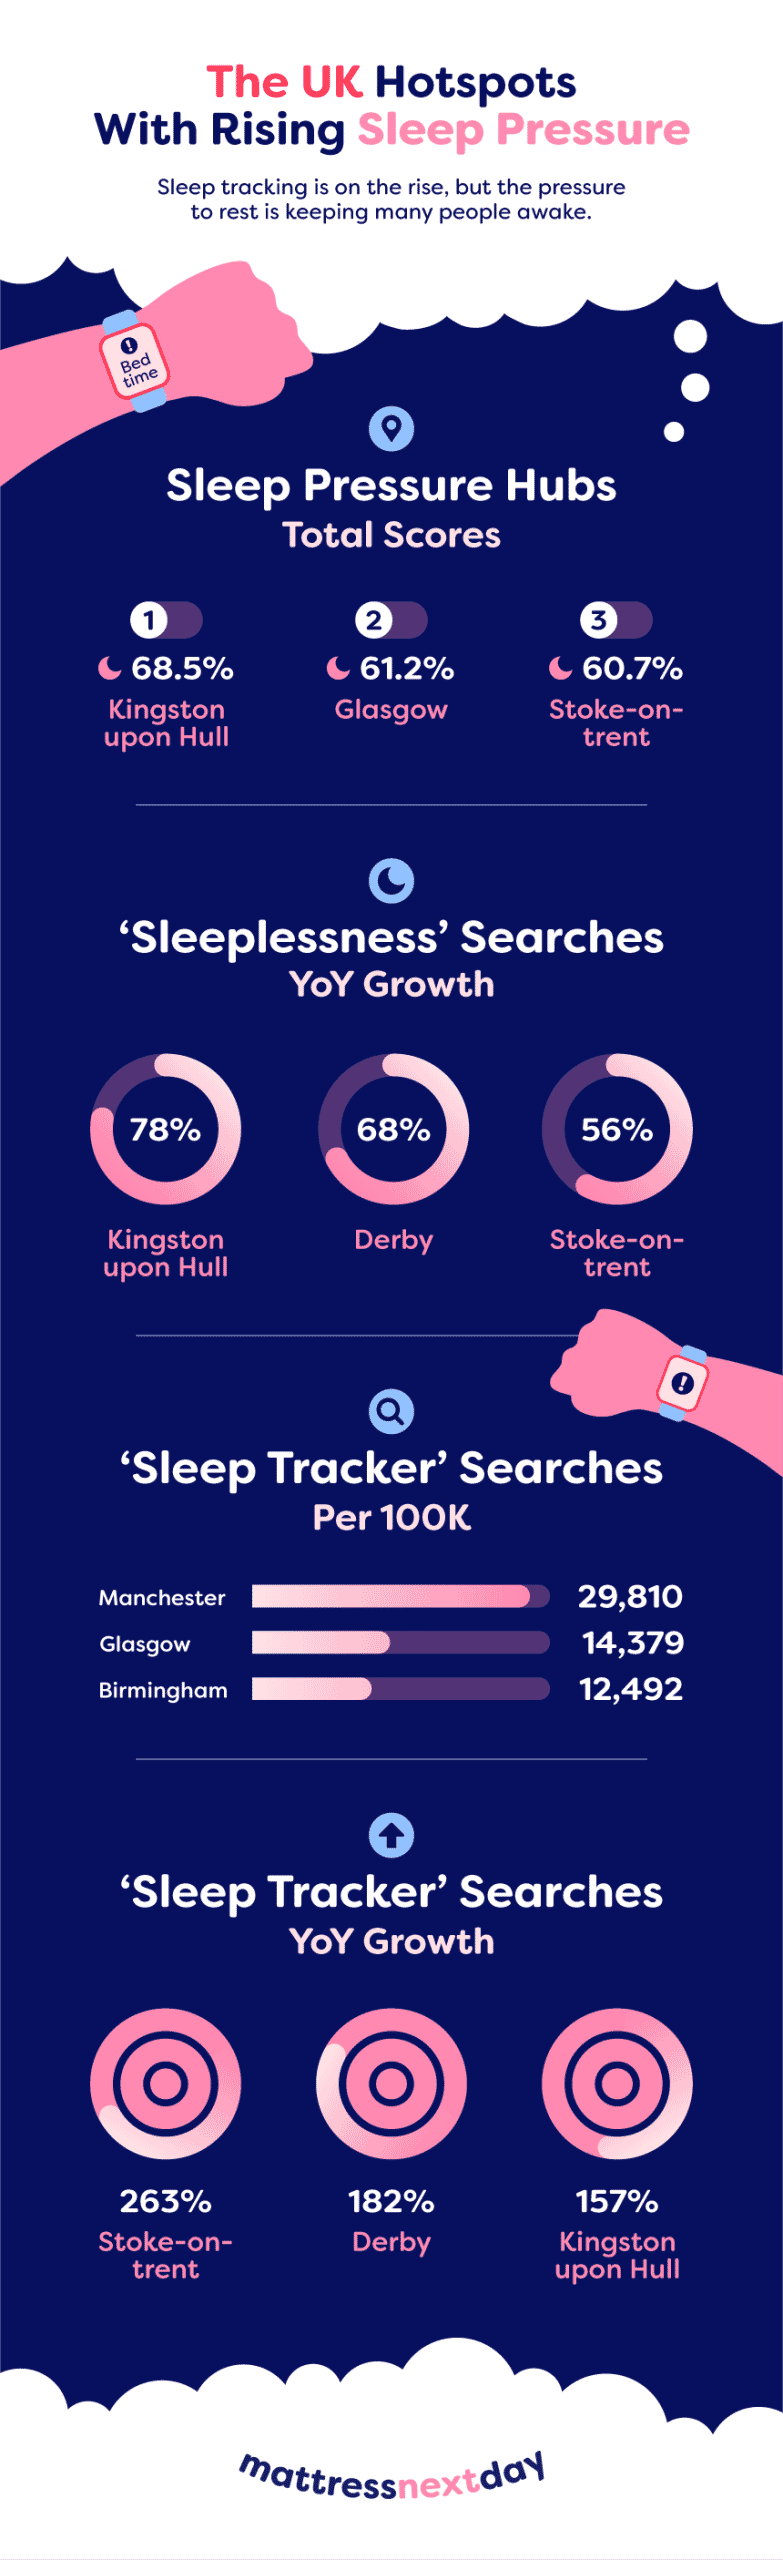
1. Kingston upon Hull
Holding the unenviable position of number one for the UK side of our study, Hull scored a whopping sleep pressure score of 68.46, sneaking it ahead of our second-place city by 7 points.
With a quite frankly staggering yearly growth around sleeplessness terms of 78% (the highest on our UK list), it’s safe to say that sleep deprivation in this northern port is definitely creeping upwards, being further reflected in the 7,193 sleep tracker searches made per 100,000 residents, which suggests a definite interest in sleep improvement.
Add to this the fact that yearly sleep tracker searches have grown by 157% since 2024, and it seems like the Kingston upon Hull’s new tracker friends may not be helping them to drift off too well as they search for better ways to get some shut-eye.
2. Glasgow
Next up, we have the Scottish city of Glasgow. Scoring 61.17 for their sleep pressure score, it seems the Scots are also making hefty use of sleep trackers.
Glaswegians had the fifth highest increase in sleeplessness searches at 29%, while sleep tracker searches continue to grow, rising by 99% in the last year alone, with 14,379 searches being made per each 100,000 residents. The rise in both hints that Glaswegians are still willing to give trackers a try if it means improving their sleep in the long term, but coincidentally, sleep seems to worsen as desire for trackers grows.
3. Stoke-on-Trent
Hopping down to the Midlands, the third most sleep-deprived city on our list is Stoke-on-Trent. With a score of 60.74, Stoke pretty much matches Glasgow for sleep pressure mentality, but has an even greater love for sleep trackers.
Indeed, according to our study, Stoke had an enormous 263% growth in sleep tracker searches for the last year – which was the highest for our UK cities. Still, despite this sizable rise in sleep tracker interest, sleeplessness in Stoke is also rising – up by 56% since 2024 with 622 searches on the topic being made per 100,000 people, which could indicate that this interest in trackers is only perpetuating a decline in sleep quality.
4. Derby
Moving on to our fourth city, Derby is unfortunate enough to make the cut thanks to a sleep pressure score of 55.04. For Derby residents searches around sleeplessness and sleep trackers have both absolutely increased this year.
Case in point, sleep tracker searches in this city have risen by a massive 182% in the last year, which is the second highest for this factor, and the same is true for sleeplessness as well, which grew by 68%, again leaning towards a correlation between sleep trackers and their contribution towards sleep perfectionism.
5. Leicester
Finally, with a score of 51.02, Leicester takes the fifth spot in our top five sleep pressured cities.
Interestingly, we see a different pattern in Leicester compared to our other top 5 cities; sleeplessness searches have actually been on the decline since last year in Leicester, dropping 7% alongside a much lower search rise around sleep trackers of 36%, suggesting that in some cases, sleep trackers may be having a positive impact on the quality of sleep.
Which are the most sleep-anxious cities in the US?
So, now that we’ve got a pretty good idea of where Brits stand on sleep trackers, what do American users think? Well, as you’re about to see, their sentiment towards these tools is much less favourable overall:
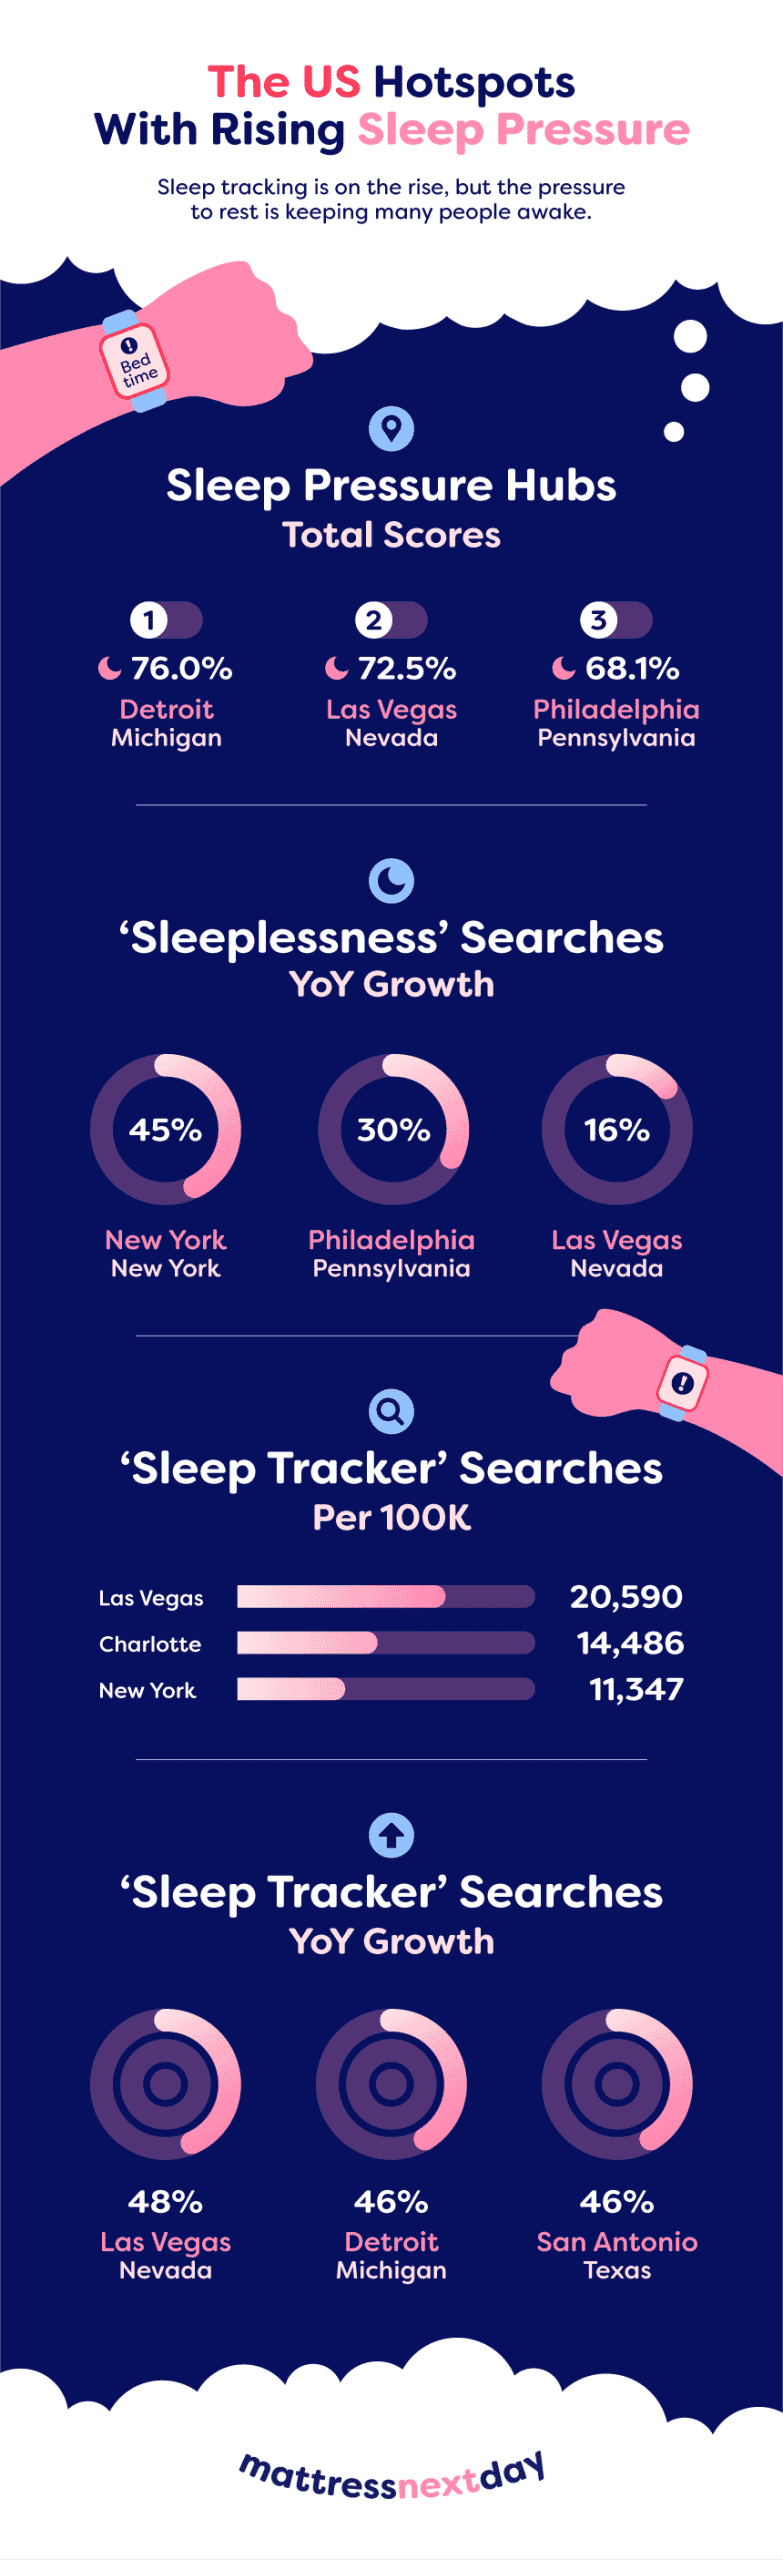
1. Detroit
First up for America, we have Detroit, which had the biggest sleep pressure score for our entire survey at 75.94.
In fact, Detroit saw a 46% growth in sleep tracker searches in the last year, putting it joint second for this factor. And this is despite only 9,328 being made per 100,000 residents, which sits at the lower end of our table for this area.
General sleeplessness searches were also not particularly high for a first-place contender, though Detroit did still see an 11% growth in searches on this topic, which hints that, while sleep tracker use is not that popular, they may still be having an impact on locals’ sleep quality.
2. Las Vegas
Following on from Detroit, we then have Las Vegas, with a score of 72.46. Sleeplessness appears to be on the rise, alongside interest in sleep trackers with a 16% search increase around sleeplessness over last year and 1,631 searches being made on the topic, coinciding with a 48% increase in the last year on tracker searches. This result suggests that orthosomnia and sleep tracking pressures continue to impact sleep routines.
3. Philadelphia
Swinging over to Pennsylvania for our third-place city, Philadelphia is unlucky enough to hold this distinction thanks to an overall sleep pressure score of 68.12. Again, tracker searches continue to increase.
More specifically, sleep tracker searches have gone up 26% since this time in 2024, with 9,452 being carried out per 100,000 residents, alongside a 30% rise in sleeplessness searches in general, making it clear that those living in Philadelphia are very much invested in their apps and bracelets, but they may not be helping as much as they think.
4. New York
Moving into fourth, you likely won’t be surprised to see the Big Apple making our list. Scoring 67.85, New Yorkers seem to be facing rising levels of sleeplessness, with a 45% search growth in this area and an average of 594 searches being made per 100,000 residents - the most out of all cities we looked at – a significant number for a city with a population of well over 8 million.
With a sleeplessness crisis seemingly impacting New Yorkers, interest in sleep trackers has risen over the same period by 31%. While many will have turned to sleep trackers to improve their sleep routines, sleeplessness levels in the city aren’t showing any signs of improving.
5. San Antonio
Last, but not least, we’re heading down to Texas and San Antonio for our fifth and final city. Holding a sleep pressure score of 64.92.
As with all of our other cities as well, searches around trackers and their use are also on the rise in San Antonio, increasing by 46%, which was actually the highest on our list of US cities. Add to this a lower increase around sleeplessness searches of 12%, and it seems that locals in San Antonio might not be facing the sleep pressures and anxiety from trackers as much as their counterparts in other US cities.
How can you improve your sleep without using trackers?
Based on the findings from our study, it’s clear that there may very well be a link between sleep tracker use and sleeplessness. However, this is by no means definitive, even if rates of orthosomnia are going up in a more general sense.
To further touch on our findings, MattressNextDay CEO and Senior Sleep Expert, Martin Seeley, had this to say on our sleep pressure results:
“While not being able to clearly show that sleep trackers and poor sleep are related, what is clear is that sleeplessness is definitely on the rise in many of our cities, suggesting that there’s still plenty we could be doing to improve sleep hygiene here in the UK. Sleep trackers, while fun and useful to a point, are absolutely not the be-all and end-all of improving your sleep, nor is the data they provide 100% accurate. Instead, if you want to improve your sleep quality consistently, you need to focus on the simple things – such as developing a consistent bedtime routine and making your bedroom more sleep-friendly. Whether it’s replacing your old mattress with a new one, ditching the phone and screens an hour before bed, or picking up a proper sleep mask, doing these little things might seem mundane, but they can all quickly add up to massively improve your sleep down the line.”
Get better rest with MattressNextDay
It might not be the most glamorous and or engaging activity, but when it comes to ‘perfecting’ your sleep, the best way to do this really is by getting a comfortable mattress, sturdy bed, and fresh bedding to tuck yourself up in at night.
So, if you’re still tempted to pick up a sleep tracking tool, why not look at upgrading your bedroom space first? Whether it’s a brand-new memory foam mattress or a double divan bed, we’re sure to have something in our range to suit your budget.
Methodology
This dataset contains 2 rankings, one which ranks the 30 most populated cities in the US and the other ranking the 30 most populated cities in the UK, based on how sleep pressure affects them and the link with the rise in popularity of sleep tracking products.
To do this, 6 different factors were used, and once the data for the factors was collected, the factors were then normalised to provide each factor with a score between 0 and 1 – if data was not available, a score of 0 was given.
The normalised values were then summed and multiplied to give each city a total score out of 100, and the cities were then ranked from highest to lowest, based on their total scores.
The factors used were as follows:
- Sleeplessness searches per 100k – The combined number of searches for the following prompts between Jul 24 - Jun 25: "trouble sleeping", "how to sleep better", "how to sleep faster", "sleep problems", "sleep remedies", and "why can't I sleep", per 100,000 population.
- Sleeplessness YoY growth – The change in percentage of the number of sleeplessness searches in comparison to Jul 23 - Jun 24.
- Sleep tracker searches per 100k – The combined number of searches for the following prompts between Jul 24 - Jun 25: "best sleep app", "sleep monitor app", "sleep tracking app", "best sleep tracker", "oura ring", "whoop", "galaxy ring", "fitbit", "garmin sleep tracking", and "withings sleep".
- Sleep tracker YoY growth – The change in percentage of the number of sleep tracker searches in comparison to Jul 23 - Jun 24.
The factors were then indexed as follows:
- All Factors – Higher equals better.
All data is correct as of 26/08/25. The ranking data shown is a compilation of multiple data sources and may not be representative of real life. All data is accurate with regard to the sources provided.


